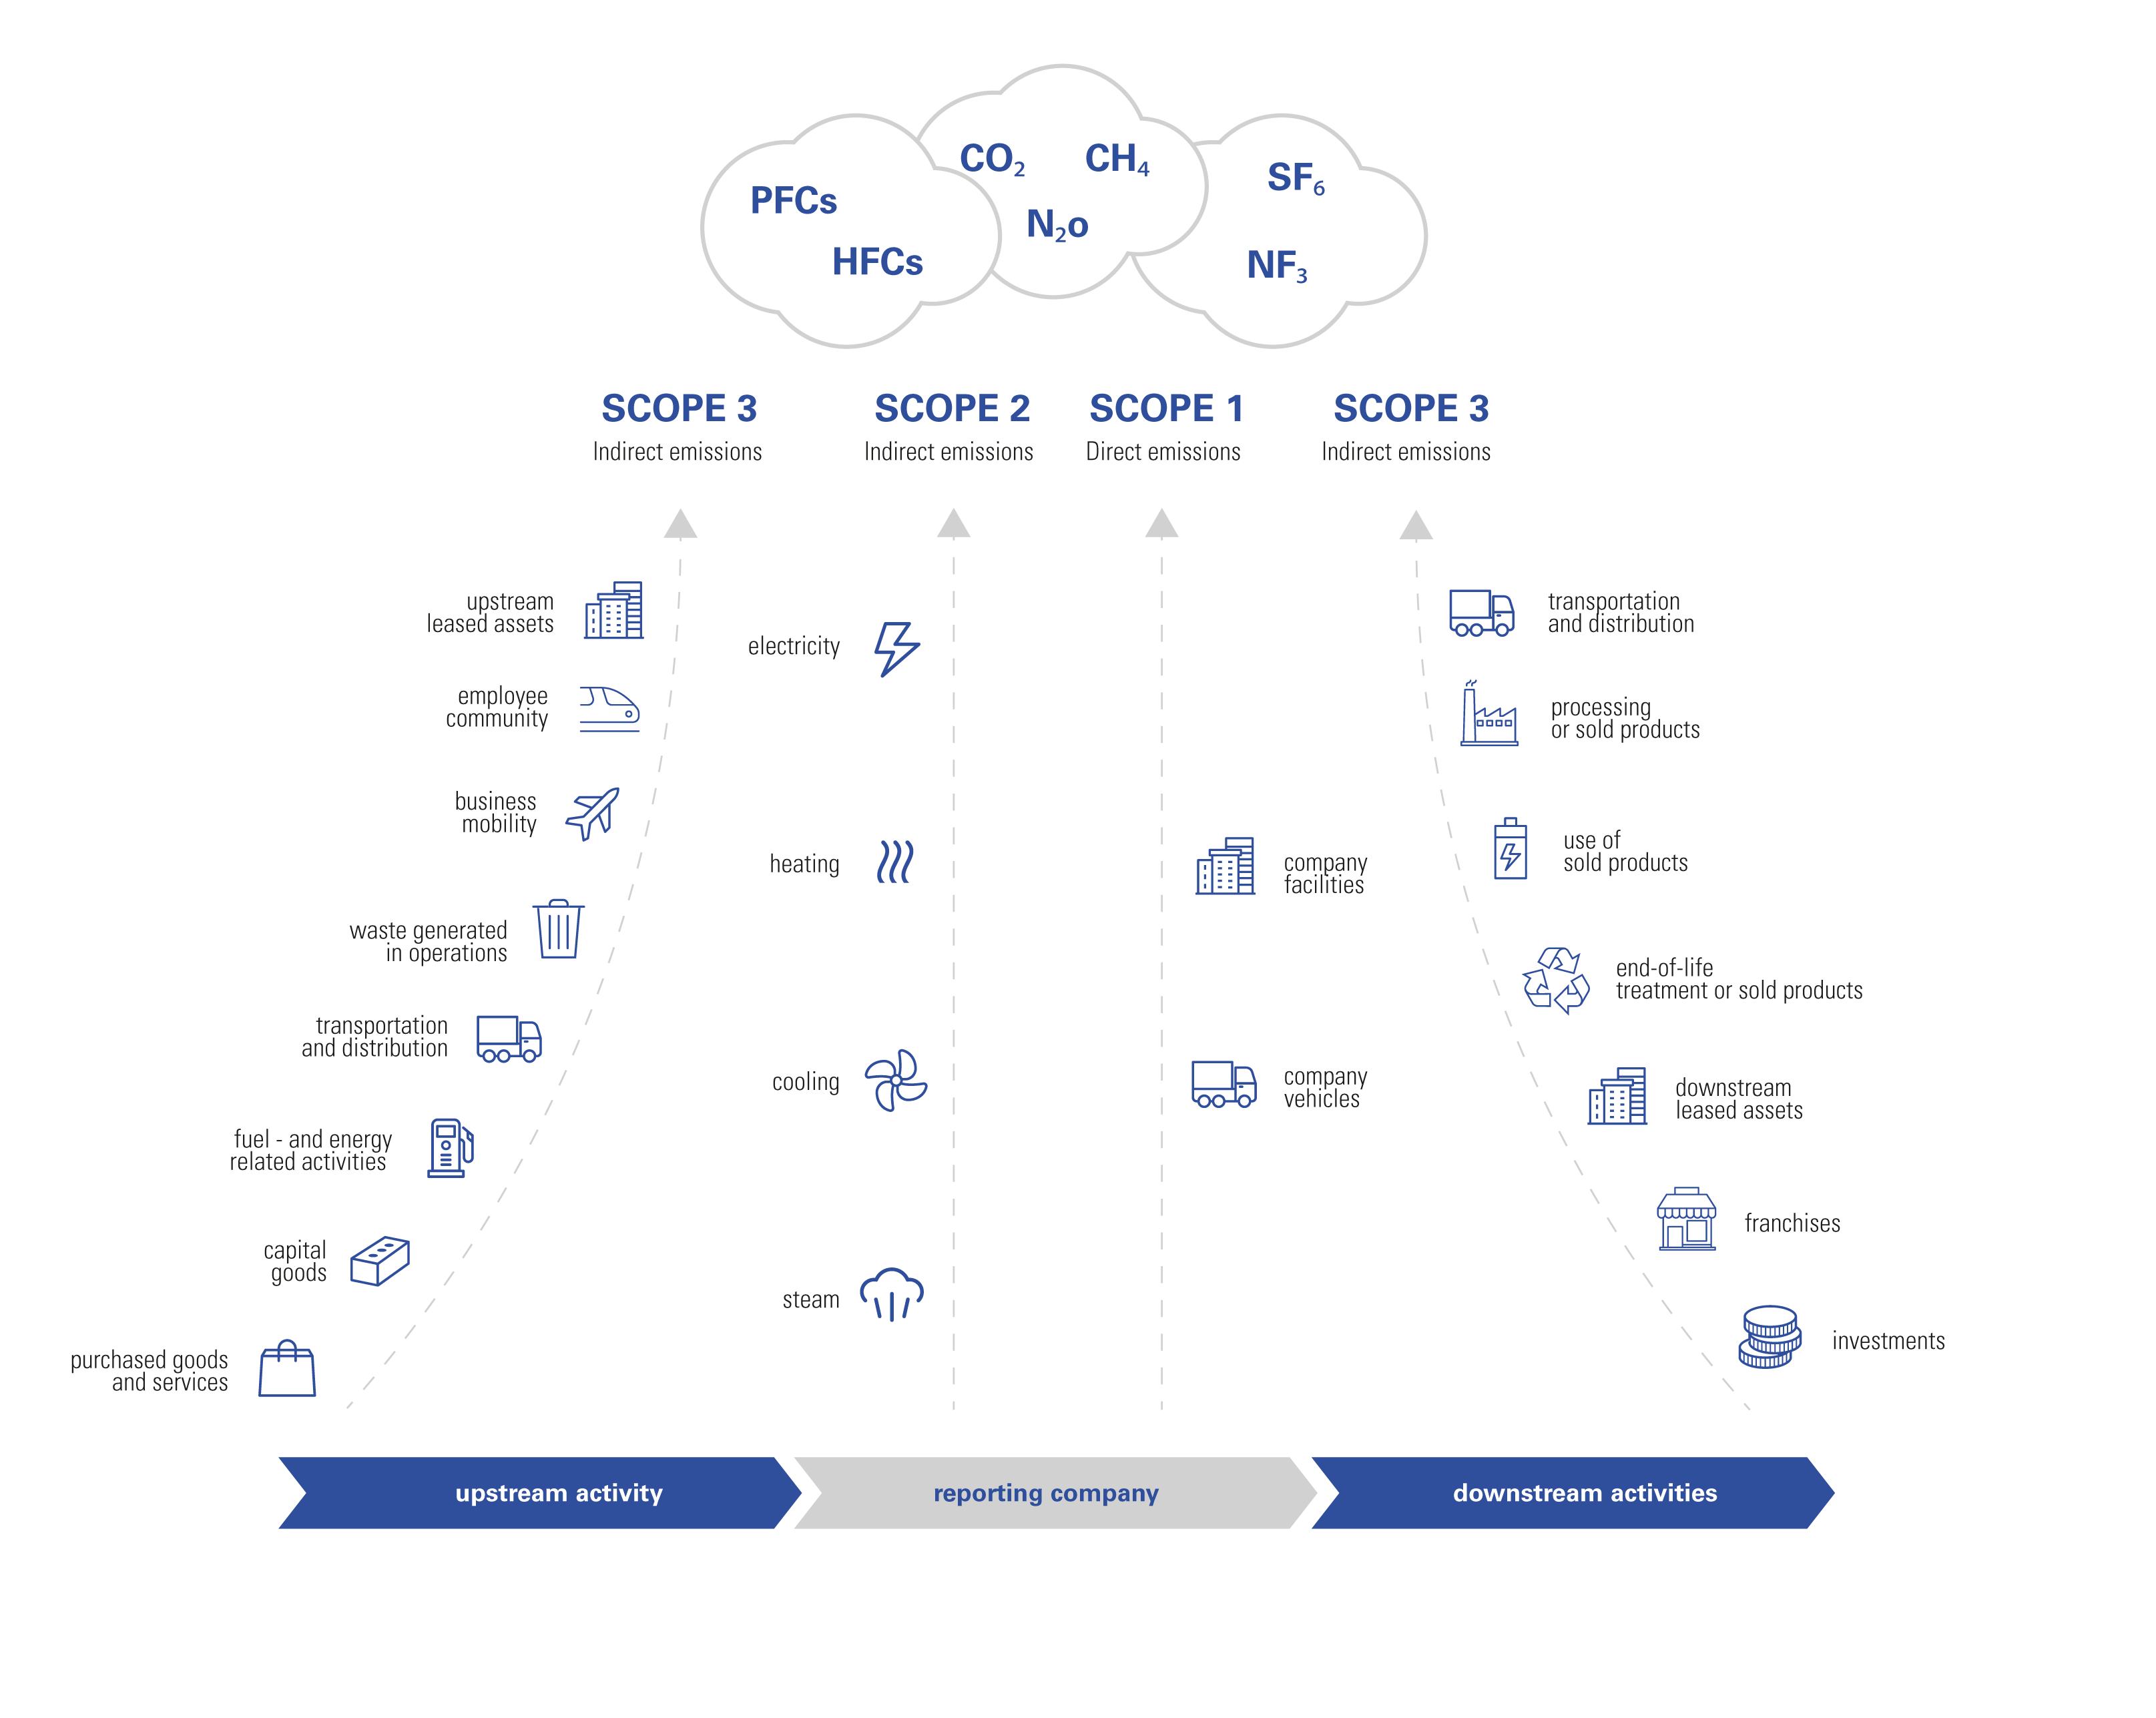
Greenhouse gas emissions (“GHG”, Greenhouse Gases) are produced by the Sesa Group directly from assets owned by the company or that the company controls operationally (scope 1) and indirectly through the electricity procurement from third parties (scope 2) and along the value chain (scope 3).
We measure and report the greenhouse gas (GHG) emissions generated by our direct operations to verify the effectiveness of the implemented reduction strategies and to demonstrate our consistency with the Group investments in sustainable infrastructures and technological innovation, aimed at promoting economic growth, creating jobs and promoting the well-being of human resources.
Thanks to the monitoring of emissions, Sesa has formulated a plan aimed at containing and reducing them. Above all, several programs have been implemented and planned to reduce energy consumption. In the financial year as of April 30, 2024, the supply of electricity certified with Guarantee of Origin from renewable sources contributed to avoid 3,071 CO.2 tons of indirect Scope 2 emissions, while the production of the Group’s photovoltaic park, equal to a total of 1,076,587 KWh, contribute to avoid 362 CO.2 tons.
We calculate our greenhouse gas emissions using the WRI GHG Protocol, applying both market-based and location-based methods. The first method, the market-based, determines GHG emissions from the purchase of electricity and heat by considering the specific emission factors reported by our suppliers. For the purchase of electricity from renewable energy sources, a zero emission factor is attributed for the scope 2. Instead, the location-based method involves accounting for emissions from the purchase of electricity, applying national average emission factors for the different countries in which we purchase electricity.
Results as of 30 april 2024
Breakdown of GHG emissions by Scope
| Greenhouse gas emissions (tCO2e) | 30/04/2024 | 30/04/2023 | 30/04/2022 | 30/04/2021 | 30/04/2020 |
|---|---|---|---|---|---|
| Scope 1 - Direct emissions, produced by heating systems and using the fleet of company vehicles | 5,269 | 4,780 | 4,397 | 3,393 | 4,068 |
| Scope 2 - Indirect emissions from energy consumption (market-based method) | 458 | 648 | 768 | - | - |
| Scope 2 - Indirect emissions from energy consumption (location-based method) | 3,796 | 3,426 | 3,430 | 2,570 | 2,588 |
| Scope 3 - Other indirect emissions from energy consumption (T&D losses), related to employees' business travel, paper and water consumption, and waste disposal | - | 552,487 | 454,096* | - | - |
| Total SCOPE 1 + SCOPE 2 | 5,728 | 5,428 | 5,165 | 5,962 | 6,656 |
| Total SCOPE 1 + SCOPE 2 + SCOPE 3 | 5,728 | 557,915 | 459,261 | 5,962 | 6,656 |
*first year reporting
Emissions per capita (tCo2)

Indicators of CO2 specific emissions
| Emission indices (tCO2/HR) | 30/04/2024 | 30/04/2023 | 30/04/2022 | 30/04/2021 | 30/04/2020 |
|---|---|---|---|---|---|
| Emissions per capita1 | 1.07 | 1.22 | 1.36 | 1.99 | 2.99 |
| Scope 1 emissions per capita2 | 0.99 | 1.07 | 1.16 | 1.13 | 1.83 |
| Scope 2 market-based emissions per capita3 | 0.09 | 0.15 | 0.20 | 0.86 | 1.16 |
| Emissions intensity4 | 1.78 | 1.87 | 2.16 | 2.93 | 3.75 |
1 (Scope 1 + Scope 2 market-based GHG emissions)/Average HR
2 Scope 1 GHG emissions/Average HR
3 Scope 2 Market-based GHG emissions/Average HR
4 (Scope 1 + Scope 2 market-based GHG emissions)/Revenues